Crashes and Bear Markets. How Bad Can It Get?
Last updated: Jun 15, 2022
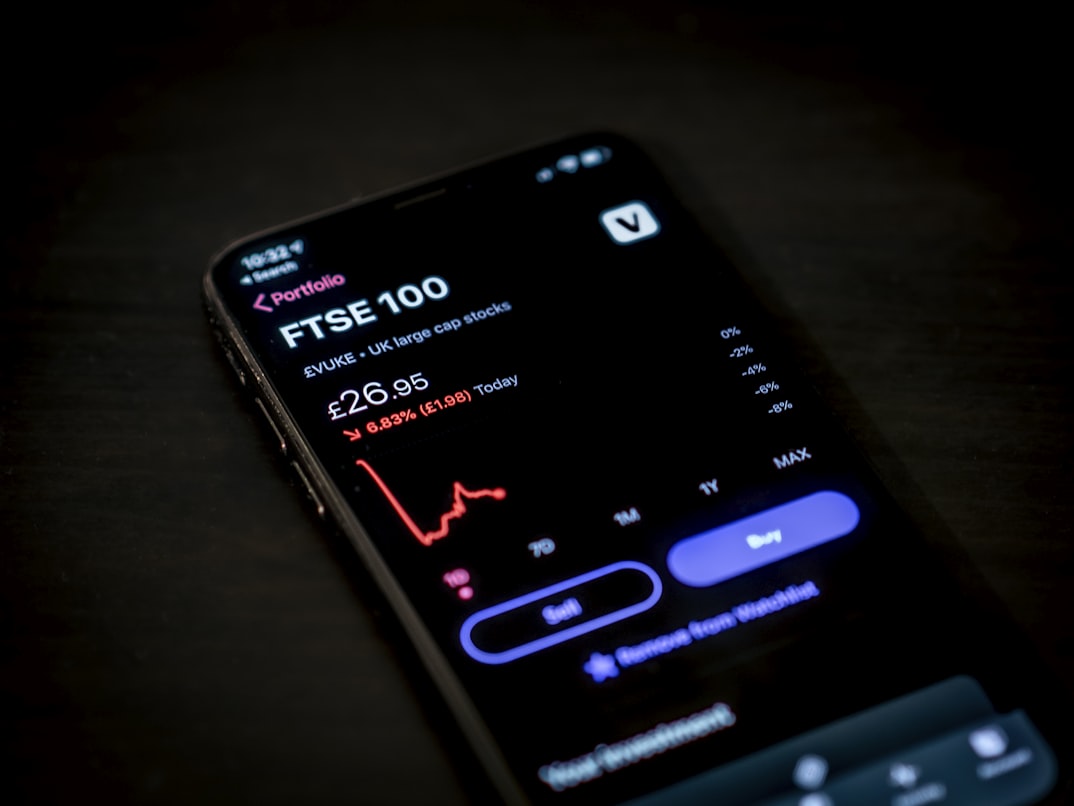
Most of us have never experienced a real stock market crash. The one in 2020 was the fastest one in history that only lasted 33 days and now the question is how bad can it get?
Since we can’t see into the future we will go over past stock market crashes and base our thesis on how bad it has been.
The first stock market was created in Amsterdam in 1611 so it’s safe to say they have been around for a long time. And with a longer period, we have more data to work with.
We will also look at data tables and charts dating from 1929 to the present time.
Bear market meaning?
A bear market is when a major index like the S&P 500 has gone down at least 20% over an extended period after a recent high.
If a stock is bearish it means it's getting sold and hence got down in price.
The First Stock Market
The first stock market was created in Amsterdam in 1611 so it’s safe to say they have been around for a long time.
And we as people haven’t evolved that much in about 400 years. So things that happened since then can still be relevant today.
Why Does the Stock Market Crash?
It’s caused by panic selling. Because well the market does only decrease in value if more people are selling than buying.
The fear of something that can have a devastating effect is indeed very good at getting people to panic sell.
When people heard about how serious corona was it triggered the fastest-selling in history.
Signs of a Market Crash
This isn’t a guarantee that a stock market will crash even if all these criteria are met. And even so, it’s hard to know when indeed the panic selling will begin.
First off, a long period of rising stock market prices increases the likelihood of a stock market crash. But this isn't the only thing.
High economic optimism where ratios are very much above their long-term averages. For example, the average PE ratio is usually around 15.
The use of debt to buy assets like stocks. With people taking loans to buy an asset like stocks the prices go up. Debt is good at inflating prices, giving out cheap loans and people spend them like it’s their own money. If people couldn’t take mortgages we would see much cheaper houses than there are today
Why are price declines so big?
The simple answer is debt. Since debt does make people spend more than they own. But still treat it as if it’s their own it inflates prices to extremes.
Try giving some kids their own money and then lend them money, and you will soon see them spend more.
You can sell candy to them for high prices and since they “have the money” they will most likely spend it. And thus have inflated the prices of the candy.
Debt is supposed to be used for investments. But when it inflates prices and is used for speculations it can be dangerous.
Biggest market drops in history
By knowing the worst-case scenarios we will very understand how bad it has gotten in the past.
The intelligent investor must never forecast the future exclusively by extrapolating the past.
- The Intelligent Investor
We can’t assume it can’t get worse than this. The future is never set.
The First Stock Market Crash: Tulip Mania Bubble (1637)
The Dutch was the most advanced economy in the world at the time. And had invented stocks and much else we see in today's economy.
This bubble started with rich people wanting tulips because they were nice looking and people later began to flip them.
And later on, almost everyone in the country bought tulips. Some even cost more than big houses and businesses.
Even tulip contracts were made so people didn’t have to own tulips but could flip these contracts. So like we do with stocks and other assets today.
Some people didn’t even want tulips anymore rather than to sell them.
Soon everyone from poor to rich people bought as many tulips as possible because they were sure to go up, right?
Even poor people took out loans on their possessions to buy these tulips.
This story ends with the first bubble. And the rivers of the Netherlands filled with corpses of people who had committed suicide since they had lost everything.
This story has probably been greatly exaggerated over the years but it is still true.
The Great Depression (1929)
1921-129 the Dow Jones Industrial Average (DJIA) had risen about 6 times. But then it fell to 89.2% at its bottom and didn’t return to that precious level for about 25 years.
This must be a very large contribution to the rise of Adolf Hitler. People were sure to be desperate and turn into a man they didn’t quite understand. And also looked for something to blame.
Black Monday (1987)
1981-1987 the DJIA rose about 350% but lost 22.6% in a single day making it the worst drop in a single day. It didn’t stop there but the market got down, even more, a decline of 36.1%.
Dot-com (2000)
1995-2000 The stock market had risen over 400% but then took a hit of 78%.
The internet was the new great thing and anything that had a .com was selling like crazy even if it didn’t make any money. Speculation in its finest.
Financial Crisis of 2008
The banks lent money to everyone who wanted to buy a house and the housing prices got massively inflated. And then fewer and fewer people were able to pay back.
There are a few good movies about this crash like The Big Short.
Corona (2000)
This crash had the fastest drop in history -12% in a day. About -37% at the bottom. The market recovered in only 4 months. About a year after the market was up +40%. The people who bought in this crash have had some extremely good returns that feel almost unreal.
This speed is for sure nothing ordinary and I understand why we have seen a lot of new investors after this crash.
Average Length of Bear Market
All the numbers here are the average. Meaning that they can greatly differ from actual bear markets.
On average every 3.6 years there is a bear market, the average decline is 36% and average length of bear market 9.6 months. Meaning stocks go up 78% of the time.
Bull markets tend to go up 114%.
Looking at these numbers we can see the market is a winner in the long run.
Stock Market Crashes Table
| Year | Bottom | Duration | Recovery |
|---|---|---|---|
| 1929 | 89.2% | 34 Months | 25 Years |
| 1937 | 54.5% | 12.8 Months | 17 Years |
| 1962 | 27.97% | 10.9 Months | 1.2 Years |
| 1973 | 48.2% | 20.7 Months | 10 Years |
| 1987 | 36.1% | 2 months | 3 Years |
| 2000 | 78% | 24 Months | 7 Years |
| 2008 | 54% | 17 Months | 8 Years |
| 2020 | 37% | 1 Months | 4 Months |
| 2022 | ??? | ??? | ??? |
Conclusion
In short, we never know when and how the market is going to crash.
So we can not for sure know how bad it can get. But we do know that in 1929 the stock market declined 89.2%.
But the average decline is 36% meaning it should be very unlikely for an 89.2% drop again. But it sure is possible we can see something similar or even worse.
Since we're in the making of history. Only in 2020, do we have a record, and records are meant to be broken.


